THE VOICE OF INTERNATIONAL LITHUANIA
|
VilNews has its own Google archive! Type a word in the above search box to find any article.
You can also follow us on Facebook. We have two different pages. Click to open and join.
|
Statistics Lithuania
- Posted by - (0) Comment
Foreign trade
2011 02 09
PRESS RELEASE
FOREIGN TRADE OF LITHUANIA IN 2010
Statistics Lithuania informs that, based on provisional data obtained from customs declarations and Intrastat reporting data, exports in 2010 amounted to LTL 54.3 billion, imports – LTL 60.9 billion. Foreign trade deficit of Lithuania amounted to LTL 6.6 billion, which is by 45.8 per cent more than in 2009. Data on trade with the EU countries were adjusted after VAT returns data had been received.
Over a year (in 2010, against 2009), exports and imports increased by 33.2 and 34.5 per cent respectively. Mineral products excluded, exports and imports increased by 29.6 and 26.5 per cent respectively; exports of goods of Lithuanian origin increased by 29.5 per cent, mineral products excluded – by 23.2 per cent. An increase in exports was influenced by a 49.4 per cent increase in exports of petroleum products, 46.7 per cent – ground vehicles, 41 per cent – boilers, machinery and mechanical appliances. An increase in imports was influenced by a 50.2 per cent increase in imports of crude petroleum, 68.4 – ground vehicles, 42 per cent – electrical machinery and equipment and parts thereof.
In 2010, the most important partners in exports were Russia (15.6 per cent), Germany (9.8 per cent), Latvia (9.6 per cent) and Poland (7.7 per cent), in imports – Russia (32.6 per cent), Germany (10.9 per cent), Poland (8.8 per cent) and Latvia (6.3 per cent).
In 2010, the largest share in exports fell within mineral products (23.6 per cent), machinery and mechanical appliances, electrical equipment (10.5 per cent), products of the chemical or allied industries (8.1 per cent), in imports – mineral products (33.3 per cent), machinery and mechanical appliances, electrical equipment (12.6 per cent), products of the chemical or allied industries (11 per cent).
In December 2010, compared to December 2009, exports and imports grew by 45.4 and 54.9 per cent respectively. Mineral products excluded, exports and imports increased by 42.5 and 41.8 per cent respectively; exports of goods of Lithuanian origin increased by 35 per cent, mineral products excluded – 27.4 per cent. An increase in exports was influenced by a 58.3 per cent increase in exports of petroleum products, 64.5 per cent – boilers, machinery and mechanical appliances, 82.1 per cent – fertilisers. An increase in imports was influenced by an 87.6 per cent increase in imports of crude petroleum, 74.4 per cent – ground vehicles.
Over a month (December 2010, against November), exports increased by 1.2 per cent, while imports decreased by 1.5 per cent. Mineral products excluded, exports and imports decreased by 2.9 and 1.6 per cent respectively; exports of goods of Lithuanian origin decreased by 1.5 per cent, mineral products excluded – by 9.6 per cent. An increase in exports was influenced by a 17.3 per cent increase in exports of petroleum products. A decrease in imports was determined by a 5.5 per cent decrease in imports of ground vehicles, 35.8 per cent – fertilisers.
Table 1. Foreign trade balance
LTL million
|
Exports |
Imports |
Balance |
|
|
2010 ◘ |
54264.3 |
60942.7 |
-6678.4 |
|
January** |
3108.5 |
3552.1 |
-443.6 |
|
February** |
3583.1 |
3938.6 |
-355.5 |
|
March** |
3856.2 |
4531.1 |
-674.9 |
|
I quarter** |
10547.8 |
12021.8 |
-1474.0 |
|
April** |
4164.8 |
4969.6 |
-804.8 |
|
May** |
4320.1 |
4634.2 |
-314.1 |
|
June** |
4655.0 |
5068.2 |
-413.2 |
|
II quarter** |
13139.9 |
14672.0 |
-1532.1 |
|
July** |
4530.5 |
5522.3 |
-991.8 |
|
August** |
4934.6 |
5268.1 |
-333.5 |
|
September** |
4970.3 |
5724.5 |
-754.2 |
|
III quarter** |
14435.4 |
16514.9 |
-2079.5 |
|
October** |
5367.5 |
5748.3 |
-380.8 |
|
November** |
5353.6 |
6037.5 |
-683.9 |
|
December |
5420.1 |
5948.2 |
-528.1 |
|
IV quarter |
16141.2 |
17734.0 |
-1592.8 |
|
|
|
|
|
|
2009 |
40732.0 |
45311.0 |
-4579.0 |
|
I quarter |
9490.8 |
10543.9 |
-1053.1 |
|
II quarter |
9543.6 |
10838.3 |
-1294.7 |
|
III quarter |
10611.8 |
11934.9 |
-1323.1 |
|
December |
3726.7 |
3840.4 |
-113.7 |
|
IV quarter |
11085.8 |
11993.9 |
-908.1 |
** Revised data.
◘ Provisional data.
Table 2. Structure of and changes in foreign trade by BEC
|
BEC |
2010 |
|||||
|
exports |
imports |
against 2009, growth, drop (-), % |
||||
|
LTL million |
% |
LTL million |
% |
exports |
imports |
|
|
Total |
54264.3 |
100.0 |
60942.7 |
100.0 |
33.2 |
34.5 |
|
Capital goods |
5317.1 |
9.8 |
6476.6 |
10.6 |
45.5 |
40.9 |
|
Intermediate goods |
27374.2 |
50.4 |
39086.1 |
64.1 |
35.8 |
41.8 |
|
Consumption goods |
15029.0 |
27.7 |
13167.8 |
21.6 |
23.4 |
13.9 |
|
Motor spirit |
4675.1 |
8.6 |
117.1 |
0.2 |
42.2 |
7.7 t. |
|
Passenger motor cars |
1723.2 |
3.2 |
2073.2 |
3.4 |
29.3 |
37.8 |
|
Other |
145.7 |
0.3 |
21.9 |
0.0 |
- |
- |
Table 3. Structure of and changes in trade with key foreign partners
|
Exports |
2010 |
Imports |
2010 |
||||
|
LTL million |
% |
against 2009, growth, drop (-), % |
LTL million |
% |
against 2009, growth, drop (-), % |
||
|
Total |
54264.3 |
100.0 |
33.2 |
Total |
60942.7 |
100.0 |
34.5 |
|
EU |
33146.7 |
61.1 |
26.6 |
EU |
34482.2 |
56.6 |
28.8 |
|
CIS1 |
14598.2 |
26.9 |
52.9 |
CIS1 |
21760.3 |
35.7 |
46.1 |
|
EFTA2 |
1653.5 |
3.0 |
32.0 |
EFTA2 |
398.7 |
0.7 |
-2.8 |
|
Russia |
8457.4 |
15.6 |
56.8 |
Russia |
19878.1 |
32.6 |
46.8 |
|
Germany |
5325.4 |
9.8 |
35.0 |
Germany |
6667.9 |
10.9 |
29.9 |
|
Latvia |
5187.4 |
9.6 |
26.6 |
Poland |
5386.6 |
8.8 |
19.2 |
|
Poland |
4174.6 |
7.7 |
42.6 |
Latvia |
3814.6 |
6.3 |
31.3 |
|
Netherlands |
2997.7 |
5.5 |
45.0 |
Netherlands |
2682.3 |
4.4 |
46.1 |
|
Belarus |
2840.7 |
5.2 |
47.7 |
Italy |
1991.4 |
3.3 |
14.7 |
|
Estonia |
2739.0 |
5.0 |
-4.3 |
Sweden |
1989.6 |
3.3 |
62.2 |
|
United Kingdom |
2661.2 |
4.9 |
48.8 |
Belgium |
1973.0 |
3.2 |
46.6 |
|
Ukraine |
1954.1 |
3.6 |
60.0 |
Estonia |
1741.0 |
2.9 |
46.5 |
|
Sweden |
1931.6 |
3.6 |
31.1 |
France |
1571.0 |
2.6 |
39.0 |
|
France |
1794.4 |
3.3 |
37.5 |
China |
1486.2 |
2.4 |
32.4 |
|
Denmark |
1625.0 |
3.0 |
4.7 |
Finland |
1080.8 |
1.8 |
27.5 |
|
Other |
12575.8 |
23.2 |
- |
Other |
10680.2 |
17.5 |
- |
1 Armenia, Azerbaijan, Belarus, Kazakhstan, Kyrgyzstan, Moldova, Russia, Tajikistan, Turkmenistan, Ukraine, Uzbekistan.
2 Iceland, Lichtenstein, Norway, Switzerland.
Table 4. Commodity structure of and changes in exports
|
CN sections, chapters |
2010 |
||||
|
LTL million |
% |
against 2009, growth, drop (-), % |
|||
|
|
Total |
54264.3 |
100.0 |
33.2 |
|
|
I–IV |
Agricultural products and foodstuffs |
9802.0 |
18.1 |
22.8 |
|
|
04 |
|
Dairy produce; birds’ eggs; natural honey; edible products of animal origin, not elsewhere specified or included |
1444.8 |
2.7 |
25.0 |
|
08 |
|
Edible fruit and nuts; peel of citrus fruit or melons |
989.3 |
1.8 |
46.1 |
|
V |
Mineral products |
12821.2 |
23.6 |
46.6 |
|
|
27 |
|
Mineral fuels, mineral oils and products of their distillation;bituminous substances; mineral waxes |
12721.7 |
23.4 |
46.6 |
|
VI |
Products of the chemical or allied industries |
4377.0 |
8.1 |
18.5 |
|
|
31 |
|
Fertilisers |
2052.6 |
3.8 |
13.1 |
|
VII |
Plastics and articles thereof; rubber and articles thereof |
3662.7 |
6.7 |
33.1 |
|
|
39 |
|
Plastics and articles thereof |
3449.2 |
6.4 |
32.2 |
|
XI |
Textiles and textile articles |
3224.1 |
5.9 |
22.8 |
|
|
62 |
|
Articles of apparel and clothing accessories, not knitted or crocheted |
965.0 |
1.8 |
18.5 |
|
XV |
Base metals and articles of base metal |
2430.6 |
4.5 |
33.8 |
|
|
73 |
|
Articles of iron or steel |
1003.8 |
1.8 |
15.9 |
|
XVI |
Machinery and mechanical appliances; electrical equipment; parts thereof; sound recorders and reproducers, television image and sound recorders and reproducers, and parts and accessories of such articles |
5721.4 |
10.5 |
40.3 |
|
|
84 |
|
Nuclear reactors, boilers, machinery and mechanical appliances; parts thereof |
3186.4 |
5.9 |
41.0 |
|
XVII |
Vehicles, aircraft, vessels and associated transport equipment |
4194.0 |
7.7 |
41.9 |
|
|
87 |
|
Vehicles other than railway or tramway rolling stock, and parts and accessories thereof |
3500.3 |
6.5 |
46.7 |
|
XX |
Miscellaneous manufactured articles |
3149.0 |
5.8 |
21.0 |
|
|
94 |
|
Furniture; bedding, mattresses, mattress supports, cushions and similar stuffed furnishings; lamps and lighting fittings not elsewhere specified or included; illuminated signs, illuminated nameplates and the like; prefabricated buildings |
2878.1 |
5.3 |
19.7 |
|
|
Other |
4882.3 |
9.1 |
- |
|
Table 5. Commodity structure of and changes in imports
CN sections, chapters |
2010 |
||||
|
LTL million |
% |
against 2009, growth, drop (-), % |
|||
|
|
Total |
60942.7 |
100.0 |
34.5 |
|
|
I–IV |
Agricultural products and foodstuffs |
7935.2 |
13.0 |
19.3 |
|
|
03 |
|
Fish and crustaceans, molluscs and other aquatic invertebrates |
825.0 |
1.4 |
28.7 |
|
08 |
|
Edible fruit and nuts; peel of citrus fruit or melons |
1199.1 |
2.0 |
35.3 |
|
V |
Mineral products |
20268.5 |
33.3 |
54.0 |
|
|
27 |
|
Mineral fuels, mineral oils and products of their distillation;bituminous substances; mineral waxes |
19518.2 |
32.0 |
55.8 |
|
VI |
Products of the chemical or allied industries |
6688.8 |
11.0 |
20.1 |
|
|
29 |
|
Organic chemicals |
1969.9 |
3.2 |
39.7 |
|
VII |
Plastics and articles thereof; rubber and articles thereof |
2718.7 |
4.5 |
32.1 |
|
|
39 |
|
Plastics and articles thereof |
2254.3 |
3.7 |
29.2 |
|
XI |
Textiles and textile articles |
2733.4 |
4.5 |
19.6 |
|
|
61 |
|
Articles of apparel and clothing accessories, knitted orcrocheted |
546.3 |
0.9 |
3.4 |
|
XV |
Base metals and articles of base metal |
3003.6 |
4.9 |
32.1 |
|
|
72 |
|
Iron and steel |
1110.4 |
1.8 |
41.7 |
|
XVI |
Machinery and mechanical appliances; electrical equipment; parts thereof; sound recorders and reproducers, television image and sound recorders and reproducers, and parts and accessories of such articles |
7649.3 |
12.6 |
27.5 |
|
|
84 |
|
Nuclear reactors, boilers, machinery and mechanical appliances; parts thereof |
4123.2 |
6.8 |
17.3 |
|
XVII |
Vehicles, aircraft, vessels and associated transport equipment |
4793.6 |
7.9 |
62.3 |
|
|
87 |
|
Vehicles other than railway or tramway rolling stock, and parts and accessories thereof |
4383.8 |
7.2 |
68.4 |
|
|
Other |
5151.6 |
8.3 |
- |
|
Table 6. Changes in imports and exports
Period |
Exports |
Exports of goods of Lithuanian origin |
Imports |
Balance |
|||
|
LTL million |
against the previous month, growth, drop (-), % |
LTL million |
against the previous month, growth, drop (-), % |
LTL million |
against the previous month, growth, drop (-), % |
LTL million |
|
|
2009-12 |
3726.7 |
2.9 |
2544.3 |
3.0 |
3840.4 |
-4.1 |
-113.7 |
|
2010-01 |
3108.5 |
-16.6 |
2310.1 |
-9.2 |
3552.1 |
-7.5 |
-443.6 |
|
2010-02 |
3583.1 |
15.3 |
2550.6 |
10.4 |
3938.6 |
10.9 |
-355.5 |
|
2010-03 |
3856.2 |
7.6 |
2540.3 |
-0.4 |
4531.1 |
15.0 |
-674.9 |
|
2010-04 |
4164.8 |
8.0 |
2858.9 |
12.5 |
4969.6 |
9.7 |
-804.8 |
|
2010-05 |
4320.1 |
3.7 |
2951.7 |
3.2 |
4634.2 |
-6.7 |
-314.1 |
|
2010-06 |
4655.0 |
7.8 |
3243.7 |
9.9 |
5068.2 |
9.4 |
-413.2 |
|
2010-07 |
4530.5 |
-2.7 |
3071.7 |
-5.3 |
5522.3 |
9.0 |
-991.8 |
|
2010-08 |
4934.6 |
8.9 |
3334.6 |
8.6 |
5268.1 |
-4.6 |
-333.5 |
|
2010-09 |
4970.3 |
0.7 |
3351.7 |
0.5 |
5724.5 |
8.7 |
-754.2 |
|
2010-10 |
5367.5 |
8.0 |
3522.2 |
5.1 |
5748.3 |
0.4 |
-380.8 |
|
2010-11 |
5353.6 |
-0.3 |
3485.6 |
-1.0 |
6037.5 |
5.0 |
-683.8 |
|
2010-12 |
5420.1 |
1.2 |
3433.7 |
-1.5 |
5948.2 |
-1.5 |
-528.1 |
Note. Due to rounding, the sum of lines or columns in some tables may disagree with the “Total”.
A press release on foreign trade in January 2011 is due on 10 March 2011.
|
Deputy Director General, Deputising for the Director General |
Jonas Markelevičius |
|
Contact: Irena Jocienė |
|
- Bookmark :
- Digg
- del.icio.us
- Stumbleupon
- Redit it
- Posted by - (0) Comment
Consumer price indices
2011 02 14
PRESS RELEASE
CHANGES IN PRICES FOR CONSUMER GOODS AND SERVICES IN JANUARY 2011
OVER A MONTH, THE GREATEST PRICE INCREASE – 1.6 PER CENT – WAS OBSERVED IN PRICES FOR TRANSPORT GOODS AND SERVICES, WHILE PRICES FOR FOOTWEAR AND CLOTHING DROPPED BY 6 PER CENT
Statistics Lithuania informs that in January 2011, against December 2010, prices for consumer goods and services increased by 0.4 per cent. The change in prices was mostly determined by an increase in prices for food products and non-alcoholic beverages, transport goods and services, housing, water, electricity, gas and other fuels group of goods and services, as well as by a decrease in prices for clothing and footwear.
In January 2011, against December 2010, prices for consumer goods increased by 0.5 per cent, while prices for services remained almost unchanged.
A monthly change in prices for food products and non-alcoholic beverages was mostly determined by a 5.7 per cent increase in prices for fruits and berries, 1 per cent – milk and its products, cheese, eggs, 0.7 per cent – bread and cereals, 2.5 per cent – coffee, tea, cocoa, 1.6 per cent – vegetables and potatoes, 2.2 per cent – butter, oils and fats.
A change in prices for transport goods and services was mostly influenced by a 2.9 per cent increase in prices for fuel (prices for petrol grew by 2 per cent, diesel fuel – 4.4 per cent, liquefied gas – 5.3 per cent), 6.2 per cent – passenger transport by rail, 0.7 per cent – motor cars, as well as by a 5.2 per cent decrease in prices for passenger transport by air.
Changes in prices for housing, water, electricity, gas and other fuels group of goods and services were mostly determined by a 14.9 per cent increase in prices for solid fuel, 5.1 per cent – liquefied gas for cooking, as well as by a 6.2 per cent price drop in prices for natural gas.
Changes in prices for clothing and footwear were influence – due to seasonal discounts – by a 6.7 per cent price drop in prices for clothing, 5.2 per cent – footwear.
In 2011, the annual inflation (January 2011, against January 2010) stood at 2.9 per cent. The annual change was determined by an increase in prices for food products and non-alcoholic beverages, transport goods and services, housing, water, electricity, gas and other fuels group of goods and services, as well as by a decrease in prices for clothing and footwear, communication goods and services, furnishings, household equipment and routine maintenance of the house goods and services.
Over a year, prices for consumer goods grew by 3.9 per cent, while prices for services dropped by 0.2 per cent.
Table 1. Rates of change in prices for consumer goods and services, January 2010
Per cent
COICOP divisions of consumer goods and services |
Relative share (weight) of consumption expenditure in total consumption expenditure |
Growth, drop (-) |
||
|
January 2010, against |
average annual |
|||
|
December 2010 |
January 2010 |
January 2010–2011 |
||
|
Total CPI |
100.0 |
0.4 |
2.9 |
1.6 |
|
Food products and non-alcoholic beverages |
26.6 |
1.1 |
6.2 |
0.5 |
|
Alcoholic beverages and tobacco products |
8.0 |
1.0 |
1.8 |
9.6 |
|
Clothing and footwear |
6.8 |
-6.0 |
-4.5 |
-5.5 |
|
Housing, water, electricity, gas and other fuels |
12.9 |
1.1 |
8.1 |
5.7 |
|
Furnishings, household equipment and routine maintenance |
6.1 |
0.6 |
-2.2 |
-2.9 |
|
Health care |
6.8 |
0.0 |
0.0 |
0.8 |
|
Transport |
11.5 |
1.6 |
7.7 |
6.1 |
|
Communications |
3.6 |
0.3 |
-4.4 |
-5.2 |
|
Recreation and culture |
6.1 |
-0.5 |
-1.8 |
-2.1 |
|
Education |
1.7 |
-0.1 |
-0.5 |
6.4 |
|
Hotels, cafes and restaurants |
4.9 |
0.4 |
0.1 |
-0.7 |
|
Miscellaneous goods and services |
5.0 |
1.1 |
0.1 |
0.2 |
Table 2. COICOP classes of consumer goods and services whose rates of change in prices had a decisive influence on the overall price change over the month
(January 2011, against December 2010)
Influence, percentage points |
|||
|
Fuels and lubricants |
+0.188 |
Clothing |
-0.294 |
|
Solid fuel |
+0.158 |
Footwear |
-0.107 |
|
Fruits and berries |
+0.082 |
Gas |
-0.030 |
|
Other non-electric appliances, articles and products for personal care |
+0.038 |
Package holidays |
-0.015 |
|
Milk and its products, cheese, eggs |
+0.037 |
Passenger transport by air |
-0.014 |
|
Non-durable household goods |
+0.035 |
Furniture and furnishings |
-0.010 |
INFORMATION ON THE REVISION OF THE SYSTEM OF WEIGHTS
Statistics Lithuania annually revises the weighting system, used for the calculation of the Consumer Price Index (CPI), and updates it taking into consideration the changes in the structure of household consumption expenditure.
The new weighting system for the CPI (see Table 1) is based on the data of 2008 (reference period of weights) household budget survey on monetary consumption expenditure, industry, domestic and foreign trade, transport and services, energy statistics, as well as other institutions’ information. Available statistical information of 2010 is also used.
The price reference period is December 2010, i.e. in 2011 each month’s prices will be compared against this period’s prices. According to the Laspeyres formula, applied to the calculation of the CPI, data on weights and prices in the reference periods have to be consistent. Therefore, the statistical data on consumption expenditure in cash 2008 were updated up to December 2010 using respective CPIs, and a new weighting system for the calculation of the 2011 CPI was developed. For the calculation, the weights were used with the accuracy to the fifth decimal place.
The weighting system developed for the calculation of the 2011 CPI was conditioned by the changed structure of household consumption, which was due to the change in prices of consumer goods and services, increase in earnings and pensions. The most significant changes in the weighting system were as follows: the increase in the specific weight of consumption expenditure on food products and non-alcoholic beverages (the greatest increase was observed in expenditure on vegetables and potatoes, milk and its products, cheese, eggs, the decrease in expenditure was observed in prices for meat and its products) – by 0.9 percentage points, housing, water, electricity, gas and other fuels products and services – by 0.8 percentage points; the decrease in the specific weight of consumption expenditure on recreation and culture goods and services – by 0.6 percentage points, communication goods and services – by 0.4 percentage points.
The current weighting system covers 514 elementary aggregates of household consumption expenditure. These elementary aggregates are further specified using additional sources of information (information of other statistical areas and institutions) to the level of representative goods and services. In the CPI, elementary aggregates of household consumption goods and services are represented by 889 goods and services.
INFORMATION ON CHANGES IN METHODOLOGY
From January 2011, the Statistics Lithuania applies the standards for the treatment of seasonal products in the Harmonised Indices of Consumer Prices (HICP) set in Commission Regulation (EC) No 330/2009 of 22 April 2009.
More information on the provisions and minimal standards and the implementation thereof of the Commission Regulation (EC) No 330/2009 is available at the website of Statistics Lithuania.
Concepts
Inflation – a decrease in the purchasing power of a currency unit, which manifests itself in a long-term increase in the average general price level.
Annual inflation shows relative changes in the average price rate between the current month and the corresponding month of the previous year.
Average annual inflation shows relative changes in the average price rate between the average of the latest twelve months and the average of the corresponding previous twelve months.
COICOP – Classification of Individual Consumption by Purpose.
A press release on the February 2011 CPI is due on 8 March 2011.
|
First Deputy Director General, |
Vilija Lapėnienė |
|
Contact: Nadiežda Alejeva |
- Bookmark :
- Digg
- del.icio.us
- Stumbleupon
- Redit it
- Posted by - (0) Comment
Unemployment rate (survey data)
2011 02 18
PRESS RELEASE
CHANGES IN THE UNEMPLOYMENT RATE IN 2010
IN 2010 THE UNEMPLOYMENT RATE STOOD AT 17.8 PER CENT
According to the estimates of the Labour Force Survey, conducted by Statistics Lithuania, the unemployment rate in the country in 2010 stood at 17.8 per cent, which is by 4.1 percentage points more than in 2009.
In 2010, the male unemployment rate was higher than the female one: the male unemployment rate stood at 21.2, the female one – at 14.4 per cent. Over the year, the male unemployment rate grew by 4.2, the female one – by 4 percentage points. In 2010, the unemployment rate in urban areas was lower than that in rural areas: the unemployment rate in urban areas stood at 16, in rural areas – at 22.4 per cent (in 2009, at 12.6 and 16.5 per cent respectively).
The youth (aged 15–24) unemployment rate in 2010, compared to 2009, grew by 5.9 percentage points and stood at 35.1 per cent. In 2010, the youth unemployment rate was twice as high as the total unemployment rate in the country.
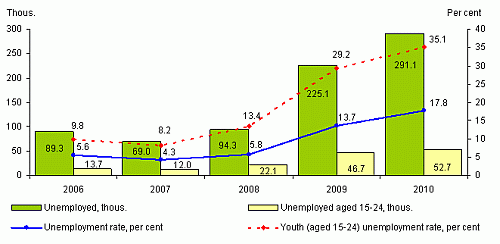
In 2010, based on the estimates of Statistics Lithuania, the number of the unemployed amounted to 291.1 thousand and, compared to 2009, grew 1.3 times. In 2010, each ninth resident of Lithuania aged 15–74 was unemployed (in 2009, each twelfth).
In 2010, the long-term unemployed, i.e. persons who have been looking for a job for a year and longer, accounted for 41.4 per cent of the total number of the unemployed. In 2010, there were 120.6 thousand long-term unemployed persons in the country. Over the year, the number of the long-term unemployed grew 2.3 times.
In 2010, based on the data of the Lithuanian Labour Exchange, the average number of the registered unemployed stood at 312.1 thousand, which is 1.5 times more than in 2009.
Based on the Labour Force Survey estimates, in 2010, there were 1 million 344 thousand persons working in the country; compared to 2009, this figure dropped by 72.2 thousand, or 5.1 per cent. Over the year, the largest decrease in the number of persons employed was observed in construction, where it decreased by 29.3 thousand, or 23.9 per cent; the number of persons employed in industry dropped by 22.2 thousand (8.5 per cent), while in professional, scientific and technical and real estate activities a slight growth was observed – by 4.2 and 1.6 thousand (9.3 and 13.5 per cent) respectively.
In 2010, the employment rate of the population aged 15–64 stood at 57.8 per cent; over the year, it dropped by 2.3 percentage points. The employment rate of males aged 15–64 was lower than that of females. In 2010, the male employment rate stood at 56.8, the female one – at 58.7 per cent; over the year, it decreased by 2.7 and 2 percentage points respectively.
In 2010, the youth (aged 15–24) employment rate stood at 19.2 per cent; over the year, it dropped by 2.3 percentage points. In 2010, the employment rate of the elderly (aged 55–64) stood at 48.6 per cent; over the year, it dropped by 3 percentage points.
IN IV QUARTER 2010, THE UNEMPLOYMENT RATE DECREASED TO 17.1 PER CENT
In IV quarter 2010, based on the estimates of Statistics Lithuania, the unemployment rate in the country stood at 17.1 per cent, which is by 0.7 percentage point less than in III quarter 2010. The male unemployment rate in IV quarter 2010 stood at 19.1, the female one – at 15.1 per cent.
In IV quarter 2010, the youth (aged 15–24) unemployment rate stood at 32.4 per cent; compared to III quarter 2010, it dropped by 3.1 percentage points.
In IV quarter 2010, the number of the unemployed amounted to 281.9 thousand, which is by 10.1 thousand, or 3.5 per cent, less than in III quarter 2010.
Based on the Labour Force Survey estimates, in IV quarter 2010, there were 1 million 367 thousand persons working in the country; compared to III quarter 2010, this figure grew by 15.9 thousand. Over the quarter, an increase in the number of persons employed was observed in construction (by 8 thousand), human health and social work (4.8 thousand), and transport and storage (3.9 thousand).
In IV quarter 2010, the employment rate of the population aged 15–64 stood at 59.2 per cent; over the quarter, it grew by 0.7 percentage point. The employment rate of males aged 15–64 was higher than that of females. In IV quarter 2010, the male employment rate stood at 59.4, the female one – at 59.1 per cent.
In IV quarter 2010, the youth (aged 15–24) employment rate stood at 21.4 per cent; over the quarter, it grew by 1.6 percentage points. In IV quarter 2010, the employment rate of the elderly (aged 55–64) stood at 50.3 per cent; over the quarter, it grew by 2 percentage points.
X X X
Statistical information is based on the Labour Force Survey data. The survey was carried out applying a sampling method. In IV quarter 2010, 14.4 thousand (0.5 per cent) residents of Lithuania aged 15 and over had been interviewed, and the survey results were subsequently recalculated for the total population of the country.
UNEMPLOYMENT RATE IN THE EUROPEAN UNION AND IN THE WORLD
Based on provisional data of the Statistical Office of the European Union (Eurostat), the unemployment rate in the European Union in 2010 stood at 9.6 per cent. The highest unemployment rate among the EU Member States was recorded in Spain (20.1 per cent), the lowest – in the Netherlands (4.5 per cent).
Based on provisional data of Eurostat, in 2010, the unemployment rate in the United States of America stood at 9.6, in Japan – at 5.1 per cent.
A press release on changes in the unemployment rate in I quarter 2011 is due on 20 May 2011.
|
Deputy Director General |
Dalia Ambrozaitienė |
| Contact: Violeta Skamaročienė Deputy Head, Living Standard and Employment Statistics Division Tel. (+370 5) 236 4958 Email violeta.skamarociene@stat.gov.lt |
- Bookmark :
- Digg
- del.icio.us
- Stumbleupon
- Redit it
VilNews e-magazine is published in Vilnius, Lithuania. Editor-in-Chief: Mr. Aage Myhre. Inquires to the editors: editor@VilNews.com.
Code of Ethics: See Section 2 – about VilNews. VilNews is not responsible for content on external links/web pages.
HOW TO ADVERTISE IN VILNEWS.
All content is copyrighted © 2011. UAB ‘VilNews’.

 Click on the buttons to open and read each of VilNews' 18 sub-sections








.jpg)
